From the "gun bubble" thread came this idea:
I have software which could generate such maps. I would only do it to the county level, which would I hope be anonymous enough to avoid big brother concerns. If someone else out there could get the data, send me a PM and we can talk further.
Results would be posted publically to this forum, along with the software code I used to generate the map. I would also like to make the data public, but would be flexible on this if there are strong privacy concerns.
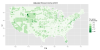
The attached image is a similar project, showing income by county (normalized to the population). Data comes from the IRS, so is only as accurate as the tax returns. Notice how Jackson Hole pops out.
It would also be interesting to see a breakdown by the home addresses of the buyers and see those little dots charted out on a map so we can see the neighborhoods in which people buy guns. Comparing that to census data, we would see socio/economic and demographic trends, as well as comparisons to crime rates in those neighborhoods.
(note: i'm not taking into account the inherent "big brother" ramifications of such a study. Just speaking from a purely academic standpoint.)
I have software which could generate such maps. I would only do it to the county level, which would I hope be anonymous enough to avoid big brother concerns. If someone else out there could get the data, send me a PM and we can talk further.
Results would be posted publically to this forum, along with the software code I used to generate the map. I would also like to make the data public, but would be flexible on this if there are strong privacy concerns.
The attached image is a similar project, showing income by county (normalized to the population). Data comes from the IRS, so is only as accurate as the tax returns. Notice how Jackson Hole pops out.