Learning to use chronograph data

Status
Not open for further replies.

Mxracer239y

Member
Joined
Nov 5, 2008
Messages
108
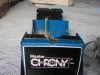
After 6 months of 45 acp reloading and beginning to transition into a couple more interesting calibers (223, 7x57, etc), I decided I needed a chronograph.

Took it out for the first time yesterday. I am addicted. I was actually impressed with the velocities I am getting out of my 5" 1911. My real question is-

What is an 'acceptable' standard deviation? I searched a bit, and didn't find much except for 'under 10 is good, over 30 is bad.' Can anyone offer any more insight than that? The std deviation for the 230 grain LRN load I have been running was 8.8 at about 850 fps.

p.s. I also found out what happens when you switch from a pistol to your iron signed AR, and don't change your point of aim. I shot my chrony the first time out. grrrr.
 

Attachments

  • PICT0072.JPG
    PICT0072.JPG
    249.5 KB · Views: 72
for me, it depends on what your expectations are.

for idpa/ipsc/steel challenge, i'm not looking for accuracy. i just want to make power-factor. so I don't really care if there's a 75 fps variation. for rifle ammo, it's pretty close to what you've listed. SD in single digits for my 600-1000 yrd ammo. under 20 for just blasting (though, for perspective, with the base velocity is 800 vs 3200, it does make a difference)

nice shot on the chrony! i've shot all my chronys a few times... get used to it. i think i posted a few years back here about the time i shot it and actually broke it, how they laughed at me on the phone but swapped me for a new one. good people. :)
 
A PhD of my acquaintance did a study on pistol ammunition and concluded that a Coefficient of Variation (CoV, the standard deviation as a percentage of the average) of 1% represented very consistent ammunition and higher values were ok for routine shooting.
Std deviation of 8.8 fps on 850 fps average is a CoV of 1.04% and is very good.

But there is no close correlation between velocity SD and accuracy at moderate ranges, you still have to shoot on the target.

At longer ranges it starts to mount up. Put the high and low velocities from your rifle loads into a ballistics program and look at the difference in drop at 600 yards or so. BPCR loading can get the extreme spread of velocity into the single digits and the SD down to two or three fps... out of 1200. You really need that sort of consistency shooting a .45-70 with its high trajectory at long range.
 
Sometimes a little information is a dangerous thing!

You can chase Standard Deviation all over the map and have fun at it. I do it all the time. The chronograph has become a really fun component of my hobby.

But don't forget that accuracy on the target is your real goal, not pleasing the chronograph.
 
One way to avoid that in the future, get a boresighter and a white piece a paper. When you change weapons go out, put up the paper, boresight, adjust, and remove the paper. Typically If I setup my chrony for pistol round to be slightly high, then rifle rounds come in just a little low of the midpoint between the sensor and the diffuser. I shoot both standing, YMMV.

Most pistol factory ammo I've chronographed runs 10-20FPS for SD. I wouldn't get caught up in SD, just use it as a means of measuring your distribution width.
 
I am too new at reloading to know what SD is considered acceptable. However, I do know that SD represents the "spread" you should expect from the batch that produced the SD. The expected "spread" is plus or minus 3 standard deviations. Hypothetically if you had an average velocity of say 800 and your SD was 20 your expected "spread" would be between 740 and 860.
 
Not exactly. SD describes a probability distribution. One SD means that ~68% of the population will be within that +/- the mean. 3 SDs should capture 95% of the population. So, what you are looking at is 3 SDs. So if your SD was 20, you would expect 95% of the shots from a hypothetical population to be between 740 and 860, but an large majority of them should be between 780 and 820. You can do some fun things with SD, but by itself it doesn't tell you everything about the load as others have pointed out. You could have a great SD (I've measure some as low as 4) but whether it translates into something useful for you is another story.
 
However, I do know that SD represents the "spread" you should expect from the batch that produced the SD. The expected "spread" is plus or minus 3 standard deviations. Hypothetically if you had an average velocity of say 800 and your SD was 20 your expected "spread" would be between 740 and 860.

Yes, or as statisticians would say it, plus or minus 3 standard deviations from the mean will encompass something over 99% of the population. However, that assumes two things: first, that the population is "normal," which means the frequency distribution follows a very specific bell-shaped curve, and second, that you know the actual standard deviation.

With regard to the first point, I don't know what distribution a population of velocities typically assumes, but there's no reason to believe it must be normal. Log-normal distributions are very common, and there are numerous other possibilities. I keep saying I'm going to do a lot of shooting one of these days and apply some goodness-of-fit tests to the data to see what the answer really is, but it hasn't happened yet. (If anyone out there has sat down and chrono'd, say, a few dozen or more identical loads during the same bench session, I'd sure love to get the data).

Second, and this is probably more important, you don't really know what the standard deviation is - you only have a estimate of it derived from the number of samples (shots) you have. The fewer shots (data points) you have, the more uncertainty about what the actual SD is. Because of that, you can't use the areas of the normal curve (sometimes referred to as a z-distribution) to calculate the expected spread, but rather the areas modified for the uncertainty introduced by a small sample size, which is known as the t-distribution.

If you have an estimate of the SD based on a 5-shot group, that gives you 4 degrees of freedom, and the tabled t value corresponding to 99% of the area under the curve is about 4.6 (instead of 3.0), meaning that you can only assume the actual range of velocities in your 800/20 example is 708 to 892. You can tighten that up by taking additional samples (more shots), which increases the degrees of freedom and tightens the curve up. By the time you get to 30 or so samples, the t-distribution starts to look pretty much like the z-distribution, and your original +/-3SD would be approximately correct.

P.S. I agree with the earlier comment that you shouldn't get too hung up on SD - I only fool around with this stuff because it's part of how I make my living.
 
I think Deavis means TWO standard deviations capture about 95% of the population.
I saw that same boo boo, but Deavis just mistyped. No big deal, he had lots of guys here as backup.
 
I guess that I am too much of a dope to understand this. I just use my chronograph to measure veloicity. I then try to lower SD. Other than that I don't really understand the readings. But it's fun playing with it. Mostly I just try to match my reloads to factory ammo.:D
 
:scrutiny:
DickM said - Yes, or as statisticians would say it, plus or minus 3 standard deviations from the mean will encompass something over 99% of the population. However, that assumes two things: first, that the population is "normal," which means the frequency distribution follows a very specific bell-shaped curve, and second, that you know the actual standard deviation.

With regard to the first point, I don't know what distribution a population of velocities typically assumes, but there's no reason to believe it must be normal. Log-normal distributions are very common, and there are numerous other possibilities. I keep saying I'm going to do a lot of shooting one of these days and apply some goodness-of-fit tests to the data to see what the answer really is, but it hasn't happened yet. (If anyone out there has sat down and chrono'd, say, a few dozen or more identical loads during the same bench session, I'd sure love to get the data).

Second, and this is probably more important, you don't really know what the standard deviation is - you only have a estimate of it derived from the number of samples (shots) you have. The fewer shots (data points) you have, the more uncertainty about what the actual SD is. Because of that, you can't use the areas of the normal curve (sometimes referred to as a z-distribution)....

There is the rare occasion that I wish I was born smart instead of so dang good-lookin.

ST

:rolleyes:
 
On pistol loads I generally pick a "ballpark" velocity and and load from one of my manuals and shoot for group mainly at 50 yds. If the load groups well I will chrono it at some later date to see exactly what I've got. Unless you are trying to be on the edge of a power factor SD and ES don't mean much out to 100 yds. Many years ago I chrono'd and machine rest tested at the same time. It happened all the time that 2 shots with the exact same velocity went 3" apart at 50 yds and 2 shots 80 fps apart went through the same hole.
 
What Jim Watson said about CoV is correct. That is the real meaure of consistency when taking experimental data. When working as a lab rat measuring structural composite samples, we were looking for CoV of 10% or less.
 
Status
Not open for further replies.
Back
Top